Bitcoin has started the month of June in a bullish manner as prices began to reverse toward the end of last month. We are currently trading 10% higher from May’s lows, set last week, at a price of $7,715 (at the time of writing). This is a good start to the month but how much further does Bitcoin have to travel to reach McAfee’s lofty prediction?
On May 24th John McAfee, the mastermind behind the self named multi-decade old anti-virus software, posted the following tweet in which he made the prediction that Bitcoin would surge past a price of $15,000 within the month of June.
My short term price predictions: in a major dip, with nearly everything dropping, the price of Docademic doubled since my prediction. The market will turn before June 12th and my predictions will hit. My algorithms predicted Trump’s June 12th date. They have never been wrong. pic.twitter.com/IGAzWPtOV4
— John McAfee (@officialmcafee) May 24, 2018
June has started on a promising note for McAfee’s prediction but how far away are we from reaching $15,000 within the month of June?
At the time of writing, Bitcoin is currently trading at a price of $7715. The market would have to experience almost a 95% price increase for Bitcoin to trade at a price of $15,000 before the end of June. A move of this magnitude would require Bitcoin to go on an incredibly bullish run in the couple of weeks ahead.
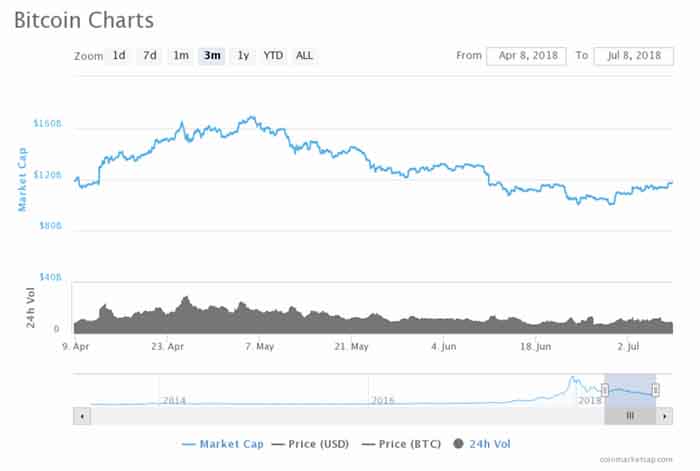
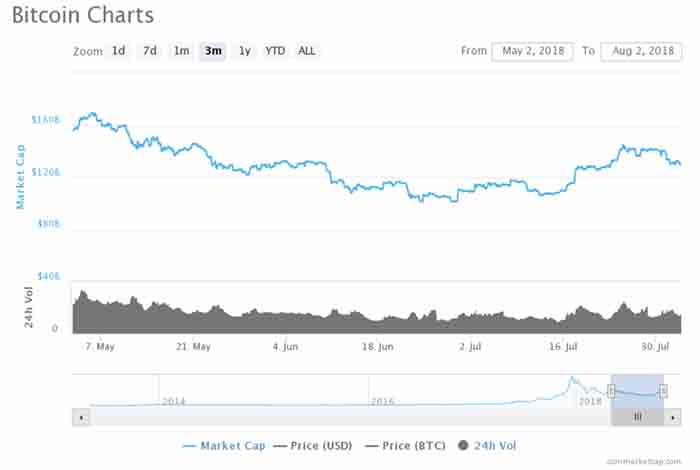
For perspective, the chart below shows current price and how far Bitcoin would need to travel before arriving at the $15,000 mark.

As you can see, price action would need to begin an incredible bullish run to reach anywhere near $15,000 before the end of the month. The $15,000 is marked in red, the vertical dashed yellow line shows the start of the year and each individual month is highlighted by the vertical grey lines.
The last time price action had witnessed the $15,000 level was on the 9th of January, earlier in the year. A single month bullish run that restored over 4 months of bearish pressure would require significant momentum to be possible.
Although we do not rule out any bullish possibility within the Bitcoin market, the chances of McAfee’s prediction coming true within the month of June are slim at best. Let us take a close look into the past years price action and see what may be possible for the month ahead.
BTC/USD PRICE ANALYSIS
LONG TERM – DAILY CHART

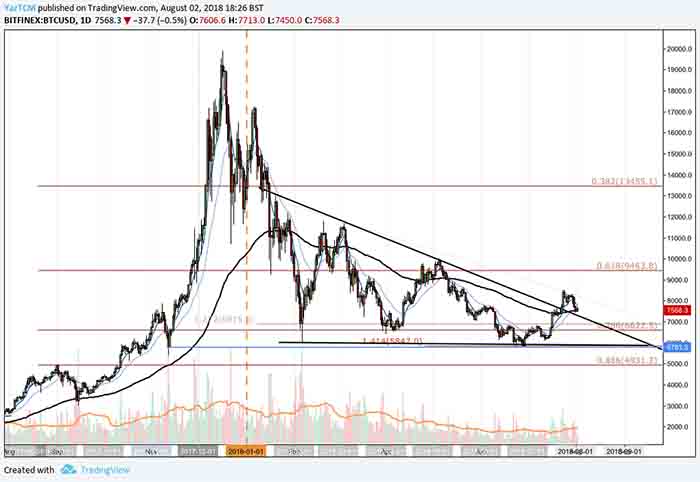
From a long term perspective, Bitcoin is neither in a bullish nor a bearish market. Instead, Bitcoin has elected to trade within the bounds of a consolidating market. More specifically, Bitcoin has been trading within the confines of the symmetrical triangle highlighted in the chart above.
Price action has been trading within this triangle for close to 5 months and is quickly approaching the apex of the triangle. Typically, symmetrical triangles resolve themselves toward the upside so a resolution of this triangle would mean a bullish run for Bitcoin.
For price to be considered to be a bullish market we would first need to see a break of the upper resistance line of the triangle. Price action would then need to break and close above the high set in May at a price of $9,990 to be considered bullish.
If price action would break below the lower support level of the triangle then we could consider Bitcoin to be heading into a bearish market as price would go on to test the lows set out in April at a price of $6,425.
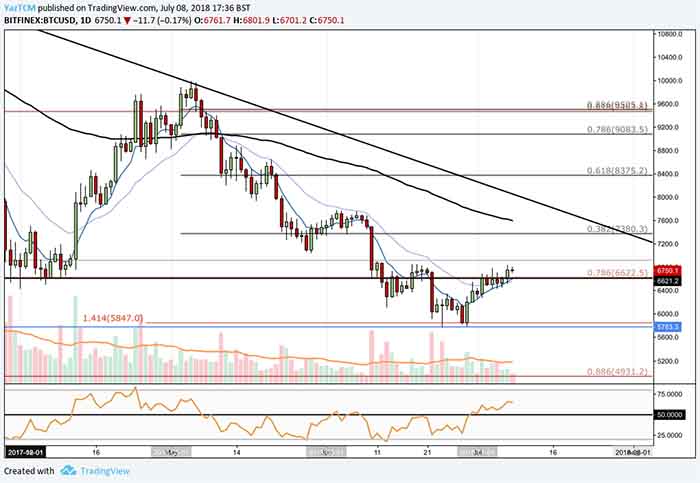
SHORT TERM – DAILY CHART

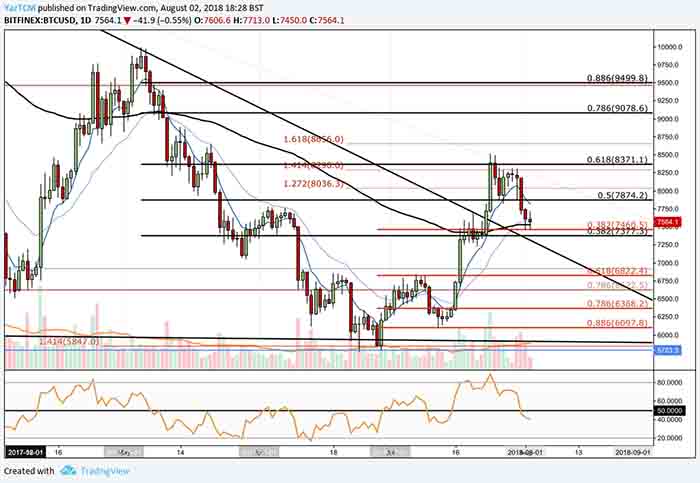
We can see that May was a rough month for Bitcoin as price fell up to 29% from the high of $9,990 to the low of $7,040. Price had retraced slightly further than the .786 Fibonacci Retracement, taken from the bullish swing experienced in April, as it found support on the lower support boundary of the triangle. Since then, price action has experienced a short term rebound and is showing signs of a promising few weeks as the month begins.
Price is currently experiencing resistance at the .618 Fibonacci Retracement level, if price can break and hold above this level then we could see price continue to rally up towards the upper resistance boundary of the symmetrical triangle. From there, we could see if price action would manage to break our long term triangle and make its move toward McAfee’s prediction (unlikely to occur in June).
The technical indicators are also beginning to show signs of positivity for Bitcoins bulls. The RSI has recently managed to break above the 50 level indicating that bullish momentum within the market is growing. We will be following RSI closely over the next few trading sessions to see if it can maintain a level above 50. The 7-day EMA and 21-day EMA are also showing positive signs for the Bulls as they make their way toward one another. If both of the EMA’s would then go on to cross one another then this would serve as a bullish signal.
CONCLUSIONS
Bitcoin markets are extremely unpredictable. Prices can fluctuate wildly on a very short term basis. The only thing we can do as traders is to wait patiently and make trading decisions based off of previous price action.
McAfee’s prediction is an extremely generous prediction for Bitcoin’s bulls. However, a price increase to $15,000 before the end of the month is a difficult task for price action to achieve. Such a significant bullish move would require a great deal of momentum within the market. The momentum is growing, but not in the way that would merit a move to $15,000 before the end of the month.
We would hope that Bitcoin could continue its bullish momentum throughout the following trading sessions this week. If the bullish momentum can continue during the month then we would consider a break of the upper boundary of the long-term symmetrical triangle a significant victory for the bulls within the market by the end of the month.
– Yasin Sheikh


 It’s true that wealth inequality has always existed, no matter what the design of the society. Whether capitalist or communist, democratic, autocratic, or plutocratic, it will exist. Yet many of the extremes we see today are avoidable. They come as a result of an unlevelled playing field, the direct consequence of certain government policies.

 European Parliament Committee on Economic and Monetary Affairs asserts that cryptocurrency can be used as an alternative to money, according to


 Money can be a serious force in driving apart friendships, family relationships or any type of relationship. We’ve all lost a few things because we decided to lend something to someone and it never got returned. And if we’re being honest, it can make us hesitant to lend out anything, especially money.
 Behind this project we can find a team with extensive experience in banking in such areas as investment business, retail risks, corporate finance and derivatives. In particular, in the area of risk, team members have successfully managed retail risks at leading Russian banks and have an understanding of how to build effective scoring/ratings models for assessing the creditworthiness of borrowers and how they can be improved. The IT division of the team is engaged in the development of complex high-load production software solutions on various scales, including using blockchain technologies for distributed storage of information.
 Blockchain and AI are two technological trends which, while ground-breaking in their own rights, have the potential to become even more revolutionary when put together. Both serve to enhance the capabilities of the other, while also offering opportunities for better oversight and accountability. Even though the two technologies have highly different developing parties and applications, researchers have been discussing and exploring their combination, and they have been found to go extremely well together. Due to its decentralized nature, blockchain can potentially neutralize the risk of one party’s monopoly of AI and their ability to control one of the most powerful and dangerous technologies known to man. AI can be incredibly revolutionary, but it must be designed with utmost precautions – blockchain can greatly assist in this.
 South Korea is softening its firm cryptocurrency regulations, thanks to agreements made during the last G20 summit that gave a