 According to a study found on BitsOnline, technical indicators show that Bitcoin could reach $3500 and restart the climb at $5000.
When the new price range between $20,000 and $3,500 is formally established, a 1st pull back level would be considered at $10,000. After a “Dead Cat Bounce,” which contributed the 4th wave according to Elliott´s Theory, a new trading resistance can be considered at $9,000. Mathematical indicators currently do not have enough strength to sustain the current price at $8,000, so the downtrend will likely resume and allow another drop to $3,500.
If the bitcoin price can recover from $3,500 to $5,000 through a climbing, ABC, zig-zag pattern, an ascending trend inside the bearish channel could be evaluated to face the $9,000 resistance.
RELATED ARTICLESMORE FROM AUTHOR

Bitcoin Analysis: Price Action Finds Support at the .382 Fibonacci Retracement; Can the Bulls Pick Up Steam From Here?
Bitcoin has suffered a small 0.05% decline over the past 24 hours of trading. This isn’t much considering the bullish run we had just experienced. The number 1 ranked crypto giant is currently being traded at $7,592 after experiencing a 7.26% drop over the past 7 trading days.
Bitcoin has had an eventful month during July as prices have risen 15.68% over the past 30 trading days. This has been partly due to the anticipation of the SEC allowing the Winklevoss Twins ETF proposal to go ahead. However, it was rejected with much debate amongst the SEC chairman who voiced her descent against the verdict. The chairman stated that she would like to not hinder the growth of an innovative technology but the rest of the board claimed the technology was still too primitive.
However, as each rejection passes we come closer and closer to an approval of an ETF which would allow serious investors to seriously consider investing into the Bitcoin asset through the ETF.
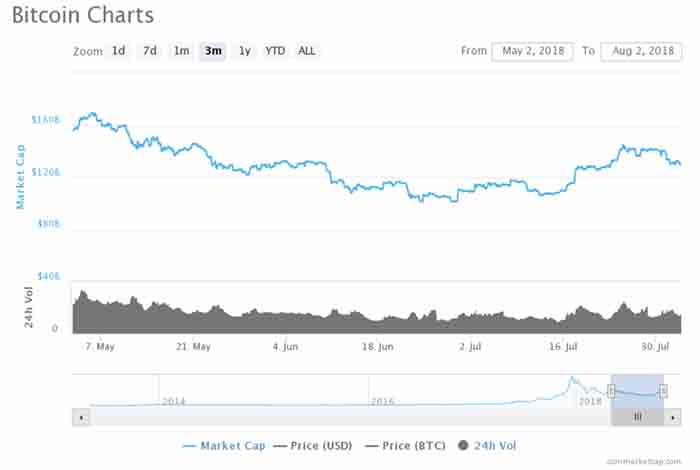
Bitcoin is currently ranked at pole position in terms of rankings across the entire industry. It currently has a market cap totalling $167 billion. However, this is $37 billion lower than the market cap high witnessed 3 months ago on May 5th 2018, as indicated in the graph below.
Let us continue to analyse price action over the long term for Bitcoin.
Price Analysis
BTC/USD - LONG TERM - DAILY CHART
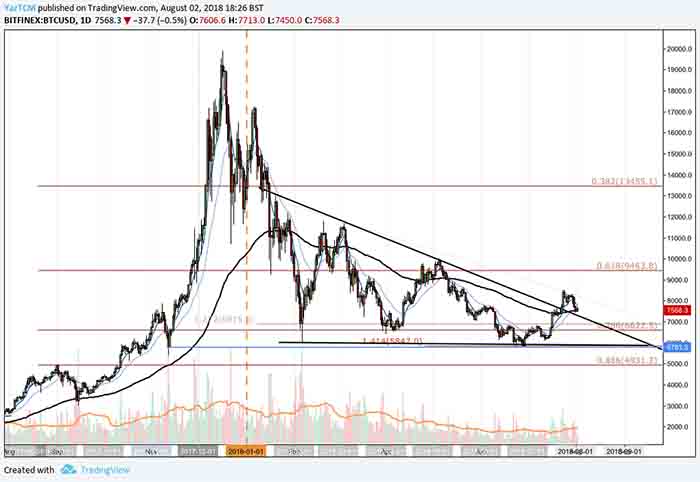
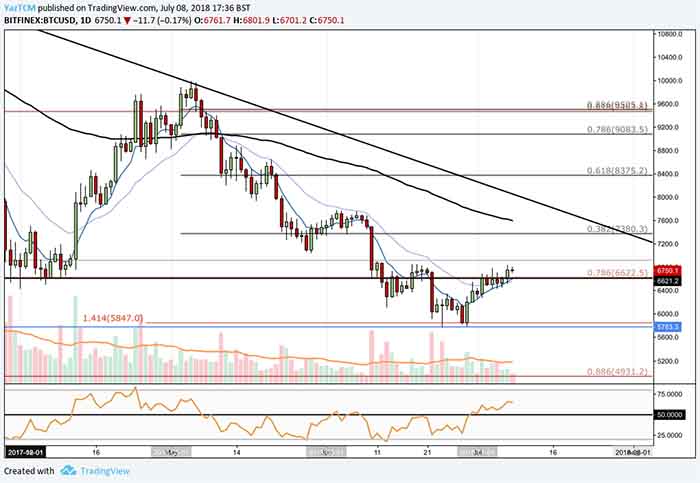
Analysing the market from the long term perspective above, we can see that Bitcoin had experienced a serious bullish run as price action started from a low of $2980 on 15th September 2017 and extended to an all time high priced at $19,891 on December 17th 2018. This was a price increase totalling 545% from low to high.
After placing the all time high, the market continued to roll over and initially found support at the .618 Fibonacci Retracement priced at $9463. This is a Fibonacci Retracement measured from the entire bullish run aforementioned. However, the market was not able to hold this level and proceeded to drop below the 100 day moving average, falling until it found support at teh .786 Fibonacci Retracement during February, priced at $6622.
We can see that for the majority of the year, price action was trading within the confines of the descending triangle highlighted above. The base of the triangle was denoted at the blue line priced at $5783 and the upper boundary acts as a falling resistance line. The market had recently broken above the upper boundary of this descending triangle as it pushed itself above the 100 day moving average.
This break above the descending triangle could signal a potential long term trend reversal, however, it is still far too early to come to this conclusion. For a confirmation that the trend truly has reversed from bearish to bullish we will be waiting until the market breaks above and completely clears the $10,000 handle.
Let us analyse price action a little closer over the short term to highlight any potential support and resistance zones.
BTC/USD - SHORT TERM - DAILY CHART
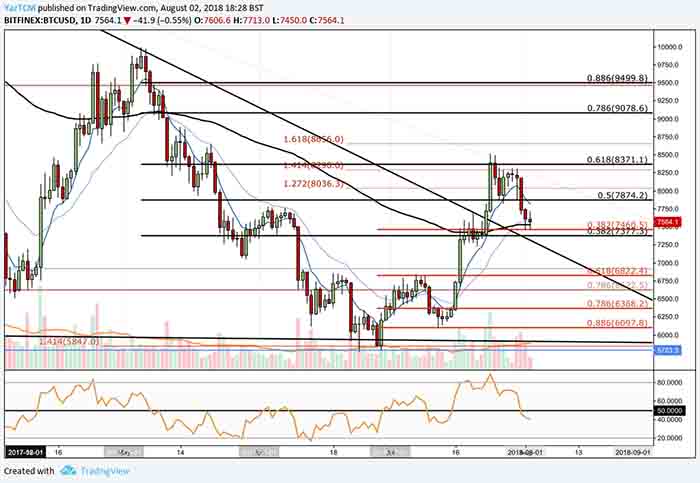
Analysing the market from a short term perspective, we can see that during May and June price action was declining from a high starting at $9964 on the 6th of May and fell to a low of $5790 on 29th of June. This low was strongly supported by the lower boundary of the long term descending triangle outlined in the previous section.
We can see that as July started trading the moving average crossed over one another (as mentioned in our previous BTC analysis article) and the market proceeded to start a small bullish run. We can see that price action started from a low of $5780 on the 29th of June and extended to a high of $8506 on the 24th of July. This was a price increase totalling 47% from low to high.
The market had hit resistance at the bearish .618 Fibonacci Retracement level (drawn in black) priced at $8371 and reversed. This is a Fibonacci Retracement measured from the bearish decline starting in May and ending in June. We can see that this area of resistance was bolstered due to a confluence of a 1.414 Fibonacci Extension level priced at $8290.
The market has since retraced slightly, finding support at the short term .382 Fibonacci Retracement (drawn in red) priced at $7460. This short term Fibonacci Retracement is measured from the bullish run starting from June 29th and ending at July 24th. We must also be aware that this support zone is significantly re-enforced by a 100 day moving average which is hovering in the same area.
If the bearish momentum continues and pushes the market below $7460, we expect the nearest level of support to come in at the short term .618 Fibonacci Retracement priced at $6822. This would most likely bring trading action back into the confines of the previous descending triangle.
Alternatively, if the short term .382 Fibonacci Retracement proves to provide a solid foundation of support, we expect near term resistance to be immediately located at the bearish .618 Fibonacci Retracement (drawn in black) priced at $8371. If the market can continue further above this level the next level of anticipated resistance lies at the 1.618 Fibonacci Extension level priced at $8656 followed by the bearish .786 Fibonacci Retracement priced at $9078.
The technical indicators within the market have recently shifted toward favouring the bears. The RSI is trading marginally below the 50 handle, indicating the recent bearish pressure over the past 5 trading days. If we are to expect the bullish run to continue, we would need to see the RSI cross back above the 50 handle.
However, the moving averages are still favouring the bulls at this moment in time. The 7 day EMA is still trading above the 21 day EMA which is still trading marginally above the 100 day SMA. However, the 7 day EMA (blue line) is pointing in a steep downward direction indicating that the bearish momentum over the recent few days is picking up. So long as the 7 day EMA does not cross below the 21 day EMA (purple line) we can still expect the market to continue its recent bullish run.

Bitcoin Showing Promising Signs as Moving Average Cross For First Time in Months
Bitcoin is set to complete its first 2 consecutive bullish weeks of price action in over 2 months, this week as the market enjoys an appreciation of 8.11% over the past 7 trading days. At the time of writing, Bitcoin is trading around $6750, recently breaking above the $6,800 barrier before falling again. Bitcoin has seen a price increase of 3.70% in the past 24 hours trading alone.
This second consecutive bullish week will be extremely important to long term Bitcoin holders who have suffered a year of sustained losses and this may provide hope that the bearish decline may soon be over.
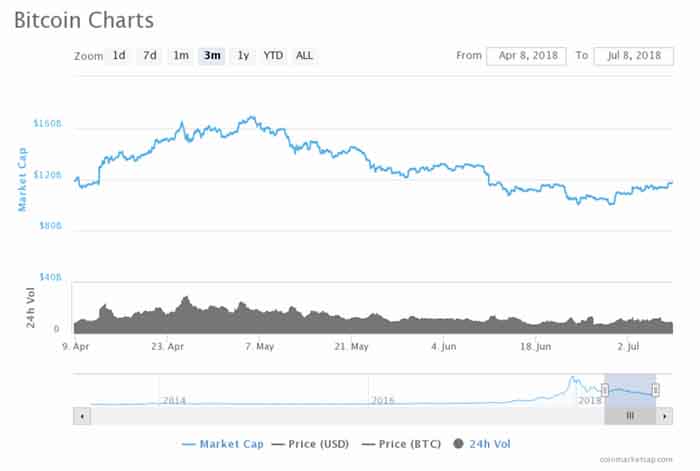
Bitcoin is currently the reigning cryptocurrency ranking in at number one in terms of overall market cap value across the entire industry, with a total market value of $117 billion. This is a significant $51 billion lower than the market cap high of $168 billion seen not two months ago on the 5th of May as indicated by the graph below.
Although this price increase could serve as a signal for a potential long term reversal, it is important not to get over excited and to wait for more confirmations before committing to any significant positions.
Let us analyse market price action over the long term and assess its performance.Price Overview
BTC/USD - LONG TERM - DAILY CHART

Analysing the market from a long term perspective, we can see that price action had experienced a major bullish run toward the final months of 2017, rising from a low of $2980 on the 15th of September 2017 to an all time high of $19,891 on the 17th of December 2017. This was an epic price increase of over 550% from low to high.
After placing this all time high, price action went on to depreciate throughout the year of 2018, originally finding support, in February, at the .786 Fibonacci Retracement priced at $6622. This is a Fibonacci Retracement taken from the epic bullish run described above. The market went on to retest this .786 Fibonacci Retracement again during April and June before breaking below this level in June.
We can also see that, before price action broke below the .786 Fibonacci Retracement, the market was trading within the confines of a descending triangle, the .786 Fibonacci Retracement effectively acted as the lower boundary of the triangle. As the market dipped below the descending triangle, it fell until it found support at $5783. This was the low day close price seen in November, highlighted by a blue horizontal line.
Price action rebounded as it hit this blue level, reversing to where it is currently trading once again at the .786 Fibonacci Retracement priced at $6622.
Let us continue to analyse price action over the shorter term closer to find some likely areas of support and resistance.
BTC/USD - SHORT TERM - DAILY CHART
Analysing the market from a closer perspective, we can see that price action rose from a low of $6425 on the 1st of April to a high of $990 on the 5th of May. This was a price increase of 55% from low to high.
Price action then went on to degrade, falling below the starting price point of the April bullish run and consequently falling below the flow of the descending triangle. We can see how price action fell all the way to the November low day day close highlighted by the blue line before aggressively rebounding. It is also important to note that this support area is bolstered by a 1.414 Fibonacci Extension level, taken from the entire bearish swing leg seen in April, priced at $5847.
Price action bounced and managed to battle back above the .786 Fibonacci Retracement where it currently finds support. If the bullish momentum can continue, the nearest level of resistance will come at the bearish .382 FibonaccI Retracement priced at $7380. This is a Fibonacci Retracement taken from the bearish decline witnessed during May and June, starting from a high of $9,990 on the 5th of May, extending lower to a price of $5,755 experienced on the 24th of June. This was a price decline of 42% from high to low.
If the bullish momentum can continue, further resistance will be found at the 100 day moving average (black line) followed by the upper boundary of the descending triangle. If the market can break above the descending triangle and clear the bearish .618 Fibonacci Retracement level at $8375 we could consider that the market has reversed into a bullish market.
Alternatively, if the bearish pressure within the market re-enters over the next few days the first area of support is expected at the blue line priced at $5783. If the bearish momentum pushes the market further lower, support can be expected at the long term .886 Fibonacci Retracement (highlighted in red) priced at $4931.
As July started trading the technical indicators began to swing into the direction that favours the bulls within the market. The RSI had battled its way up from oversold conditions at the 20 handle in mid-June and above the 50 handle. This indicates that the bullish momentum within the market is growing and that the bearish momentum has subsided. If the RSI can continue to remain above the 50 handle, we can continue to expect the bullish momentum to continue.
SImilarly, the moving averages are providing strong favour toward the bulls within the market. The 7 day EMA (blue line) and the 21 day EMA (purple line) have crossed up above one another for the first time in over 2 and a half months. If the 7 day EMA can continue to move away from the 21 day EMA this will indicate that the bullish pressure within the market is increasing.
CONCLUSION
It is extremely easy to get overly excited within the crypto markets when price action posts a couple days of green momentum. However, in the case of Bitcoin we need to continue to remain disciplined and wait for confirmations that the trend has indeed reversed. A break to the upside of th descending triangle could suffice as an initial confirmation that the market is in the process of a reversal.

Bitcoin Begins to Regain Some of the Losses Experienced Last Week
Over the past week, Bitcoin has been struggling against the dollar as it falls far below $7,000. However, throughout the course of the week the cryptocurrency giant has found support and price action is currently trying to make a recovery as prices rise by 3.10% over the past 24 hours as Bitcoin trades hands around $6730.
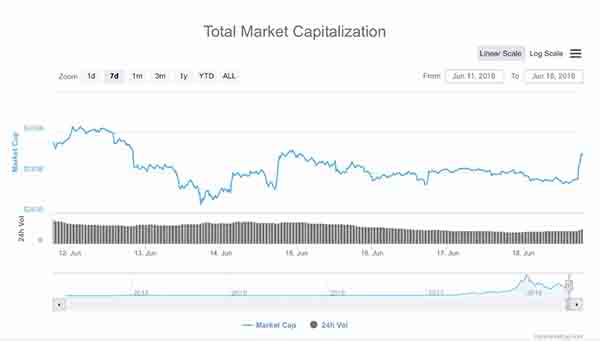
We saw cryptocurrency markets sink significantly last week as the total market capitalisation of all coins fell from $340 billion on the 9th of June to a low of $265 billion experienced on the 13th of June. This was a significant $75 billion market wipe out in a matter of just a few days.
Since the low, market cap has found some support as it continued to trade sideways for the past few days until a small break out was seen recently as the market cap currently sits at $289 billion.
One more interesting thing to note that has occurred during the past week is the recent rise of Bitcoin dominance back above 40%. This is beginning to show that Bitcoin is starting to regain some of the dominance lost as it outpaces growth relative to other altcoins.
The graph below shows us the market capitalisation of the top altcoins by percentage over the past year. We can see that during the 2017/2018 altcoin “boom” Bitcoin dominance fell a significant amount from a high of 64% on December 17th 2017 to a low of 33% on January the 4th 2018.

Let us examine Bitcoins price action over the long term and analyse the market.
Price Analysis

Looking at the market over the long term, we can see that Bitcoin was trading within the confines of a descending triangle for a period of 6 months before price broke below.
Price action had started the year by putting a high in at $17,252 before the market experienced a significant correction and fell to a low of $6,000 set in early February. Since then, the market had traded in a period of consolidation as price action traded it’s way through the triangle.
Over the next month, we could see price action making a retest at $8,000 if Bitcoin can remain above $6,200 throughout the next few days of trading. Alternatively, the nearest level of support seen below $6,200 is at the $6,000 price handle. If price action manages to break below $6,000 then June and July will turn into very bloody months for the entire cryptocurrency market.
Bitcoin dipped below the triangle during the market wipe out which started last Sunday on the 10th of June. However, we can see that price action has recently found it’s way back within the confines of the triangle once again. One interesting thing to note is that price action has not yet broken below the descending triangle on the BTC/GBP charts as seen below:
BTC/GBP - LONG TERM - DAILY CHART

Looking at the BTC/GBP above, we can see that Bitcoin has not broken below the long term descending triangle. Instead, price action has found support on the lower boundary of the triangle and has since bounced from this support level.
This should provide some more validation that the potential long term descending triangle described in the US Dollar chart previously, is still in play if BTC/USD can break back above into the triangle.
Let us examine price action for BTC/USD over the more recent term a little closer
BTC/USD - SHORT TERM - DAILY CHARTS

Looking at market action over the more recent months, we can see that the recent bearish action has been an extension of the declines witnessed in the previous month. Since early May, price action has fallen from a high close to $10,000 to a low close to $6,000 recently experienced last week.
We can see that price action has found some form of support at the downside 1.272 Fibonacci extension priced at $6,264. This is a Fibonacci extension taken from the entire bearish leg seen during May from high to low.
Price action has recently broke back into the descending triangle. If price action can close within the triangle today we could consider that this triangle may be back into long term play as validated from the BTC/GBP charts above. In this scenario, if Bitcoin can break above $7,000 then it is free to make an attempt at June’s high placed at $7,779.
Alternatively, if price action does not manage to close within the triangle and this bearish pressure continues, we could see prices take another test at recent support seen around $6,264. If price action continues lower the closes handles of support are located at $6,000 and then $5,847.
Over the past week the technical indicators have largely been favouring the bears, however, recent price action has begun to swing technical indicators towards the bulls. The RSI has spent most of the last week stuck in oversold conditions below 20. RSI has recently made its way closer to the 50 handle, if it can break above the 50 handle this would indicate that bullish momentum is starting to really increase within the market.
Price action has also recently broke above the 7 day EMA (blue line) indicating that price is currently trading above the average price taken over the past 7 days which could indicate to the bulls that the bears have started to lose steam within the market. If the 7 day EMA can eventually cross above the 21 day EMA (purple line) this would send signals to all bulls that a market shift may be occurring.
Conclusions
We have been following the development of this long term descending triangle for over half a year now. Recently analysts were startled as price action dipped below the triangle, worried that the worst case scenario was unfolding for Bitcoin.
However, the triangle is still strongly in play on the BTC/GBP charts indicating that it may still be valid if price action can re-enter the triangle on the BTC/USD market.
We will closely be watching momentum over the next few trading sessions to see if bulls can continue this short term run they have started.

Will Bitcoins 6th Day Reversal Price Theory Hold Up?
The past week has seen some decent price action for the bulls as price had risen from a low of $7,040, on the 29th of May, to a a high of $7,779, set on the 3rd of June.The past week has seen some decent price action for the bulls as price had risen from a low of $7,040, on the 29th of May, to a a high of $7,779, set on the 3rd of June. However, the past two trading sessions have seen negative pressure from the bulls as price has fallen and is currently exchanging hands at $7,419, around a 5% reduction in price from the highs.
Over the past few weeks, there have been some traders that have noticed that the monthly cyclical price action of Bitcoin’s short-term trend has been reversing over the previous five months toward the start of each month. More specifically, since the month of January, Bitcoin has experienced a price reversal on the 6th day of each month as highlighted in the chart below.

The chart above shows the daily price of Bitcoin over the span of the current year. The start of the year is highlighted by the dashed yellow line toward the beginning of the chart. The start of each month is highlighted by a faint gray line and the 6th day of each month is indicated by the bold black vertical lines.
If you closely examine price action around the area of the 6th day of each month, you will see that a short term momentum shift occurs, as the market shifts in market trading conditions. For example, the month of January was, overall, a bearish month starting from the 6th of January. Then on the 6th of February the market shifted in trading conditions from bearish to bullish and remained bullish all up until the 6th of March where the market experienced another reversal and switched from bullish to bearish.
As the 6th of the month approaches, can price action continue to make significant reversals on the 6th day of every month?
Let us examine price action over the past few months and see how likely it is that this reversal might occur.BTC/USD PRICE ANALYSIS
LONG TERM – DAILY CHART

From a long term perspective, the Bitcoin market has been consolidating within the confines of a symmetrical triangle for the past five months. This means that, on a long term technical basis, the market is neither bullish nor bearish.
Looking at the chart above, we can see that each price reversal that has occured since the 6th of February, has occured on the 6th of the month on either the upper boundary of the symmetrical triangle or the lower boundary of the triangle.
For this market to be considered a bullish market we would need to see price break and hold above the symmetrical triangle before making attempts at the highs set in early May at a price of $9,990.
As the 6th of June rapidly approached could price action follow this recent pattern in reversals?
SHORT TERM – DAILY CHART

Looking at the chart above, we can see that over the past few days Bitcoin had made a small attempt at a recovery but the bulls had ran into resistance close to the .618 Fibonacci Retracement at price $7,836. Since this price has started to retrace lower back toward previous support located at $7,251.
For the 6th day theory, including the reversal occurring at the symmetrical triangle, to hold true, we would need to see price action to reduce by around 5% from current prices, either today or tomorrow, to reach the lower boundary of the symmetrical triangle. Due to the low volume and momentum,this would be a difficult task for price action to fall within such a short space of time.
However, for the original 6th day theory to hold firm without the added confirmation from the technical triangle pattern, price action would just have to make a reversal at the current levels on the 6th of June. If price action manages to reverse on the 6th then we could expect to experience a solid month of gains during the month of June.
The technical indicators are not providing much confidence for the 6th day reversal theory on a daily time frame. RSI is currently trading below the 50 handle indicating the short-term bearish momentum within the market. For a reversal to occur we would need to see RSI battle it’s way up above and hold above 50. To add to this lack of confidence, the 7-day EMA and 21-day EMA are pointing in the downward direction and show no indication that they are ready to pull closer to one another in the short-term.
SHORT TERM – 4-Hr CHART

Taking an even deeper dive into price action, we can see that Bitcoin may actually be showing some short term signs that this 6th day price reversal theory may show some merit.
We can see that price action has retraced up until a short term .50 Fibonacci Retracement level at a price of $7,408. This is a Fibonacci taken from the short term bullish swing from a low seen on the 29th of May to the high seen earlier this month. At the .50 Fibonacci Retracement, price action has managed to find some support and have shown positive signs of reversing. More specifically, price action has managed to show positive signs that the reversal may indeed happen, once again, on the 6th of the month.
The technical indicators, on the 4-hour basis, also aid to the fact that a reversal may occur on the 6th. RSI over the past trading session had reached oversold conditions and has began to show signs of reversing as it makes its way up above 50. If RSI can break above 50 over the next couple of trading sessions then we will be experiencing a price reversal within the market.
CONCLUSIONS
As traders, we find technical patterns and make trading decisions based off of the validity of these trading patterns confluencing with one another.The 6th day theory has shown some merits of validity over the past few months. However, it is important to note that past history of sentiment is not indicative of future sentiment. Meaning that just because a price reversal has happened on the 6th previously, does not mean that it will happen every month on the 6th. It is important for traders to let price action be the deciding factor when beginning to execute on any trade.
It is also important to note that price action has been showing indicators for a potential reversal over the past few weeks now. The reversal seems to be imminent but will it happen on the 6th of June? The good news for traders is that even if it does not occur on the 6th, it will occur over the following few days.
The 6th of the month approaches tomorrow, where we will see if this theory continues to hold its validity.
– Yasin Sheikh
 Begins A Promising June But How Far Away Are We From Reaching McAfee’s Prediction?")
Bitcoin (BTC) Begins A Promising June But How Far Away Are We From Reaching McAfee’s Prediction?
Bitcoin has started the month of June in a bullish manner as prices began to reverse toward the end of last month. We are currently trading 10% higher from May’s lows, set last week, at a price of $7,715 (at the time of writing). This is a good start to the month but how much further does Bitcoin have to travel to reach McAfee’s lofty prediction?
On May 24th John McAfee, the mastermind behind the self named multi-decade old anti-virus software, posted the following tweet in which he made the prediction that Bitcoin would surge past a price of $15,000 within the month of June.
My short term price predictions: in a major dip, with nearly everything dropping, the price of Docademic doubled since my prediction. The market will turn before June 12th and my predictions will hit. My algorithms predicted Trump's June 12th date. They have never been wrong. pic.twitter.com/IGAzWPtOV4
— John McAfee (@officialmcafee) May 24, 2018
June has started on a promising note for McAfee’s prediction but how far away are we from reaching $15,000 within the month of June?
At the time of writing, Bitcoin is currently trading at a price of $7715. The market would have to experience almost a 95% price increase for Bitcoin to trade at a price of $15,000 before the end of June. A move of this magnitude would require Bitcoin to go on an incredibly bullish run in the couple of weeks ahead.
For perspective, the chart below shows current price and how far Bitcoin would need to travel before arriving at the $15,000 mark.

As you can see, price action would need to begin an incredible bullish run to reach anywhere near $15,000 before the end of the month. The $15,000 is marked in red, the vertical dashed yellow line shows the start of the year and each individual month is highlighted by the vertical grey lines.
The last time price action had witnessed the $15,000 level was on the 9th of January, earlier in the year. A single month bullish run that restored over 4 months of bearish pressure would require significant momentum to be possible.
Although we do not rule out any bullish possibility within the Bitcoin market, the chances of McAfee’s prediction coming true within the month of June are slim at best. Let us take a close look into the past years price action and see what may be possible for the month ahead.
BTC/USD PRICE ANALYSIS
LONG TERM – DAILY CHART

From a long term perspective, Bitcoin is neither in a bullish nor a bearish market. Instead, Bitcoin has elected to trade within the bounds of a consolidating market. More specifically, Bitcoin has been trading within the confines of the symmetrical triangle highlighted in the chart above.
Price action has been trading within this triangle for close to 5 months and is quickly approaching the apex of the triangle. Typically, symmetrical triangles resolve themselves toward the upside so a resolution of this triangle would mean a bullish run for Bitcoin.
For price to be considered to be a bullish market we would first need to see a break of the upper resistance line of the triangle. Price action would then need to break and close above the high set in May at a price of $9,990 to be considered bullish.
If price action would break below the lower support level of the triangle then we could consider Bitcoin to be heading into a bearish market as price would go on to test the lows set out in April at a price of $6,425.
SHORT TERM – DAILY CHART

We can see that May was a rough month for Bitcoin as price fell up to 29% from the high of $9,990 to the low of $7,040. Price had retraced slightly further than the .786 Fibonacci Retracement, taken from the bullish swing experienced in April, as it found support on the lower support boundary of the triangle. Since then, price action has experienced a short term rebound and is showing signs of a promising few weeks as the month begins.
Price is currently experiencing resistance at the .618 Fibonacci Retracement level, if price can break and hold above this level then we could see price continue to rally up towards the upper resistance boundary of the symmetrical triangle. From there, we could see if price action would manage to break our long term triangle and make its move toward McAfee’s prediction (unlikely to occur in June).
The technical indicators are also beginning to show signs of positivity for Bitcoins bulls. The RSI has recently managed to break above the 50 level indicating that bullish momentum within the market is growing. We will be following RSI closely over the next few trading sessions to see if it can maintain a level above 50. The 7-day EMA and 21-day EMA are also showing positive signs for the Bulls as they make their way toward one another. If both of the EMA’s would then go on to cross one another then this would serve as a bullish signal.
CONCLUSIONS
Bitcoin markets are extremely unpredictable. Prices can fluctuate wildly on a very short term basis. The only thing we can do as traders is to wait patiently and make trading decisions based off of previous price action.
McAfee’s prediction is an extremely generous prediction for Bitcoin’s bulls. However, a price increase to $15,000 before the end of the month is a difficult task for price action to achieve. Such a significant bullish move would require a great deal of momentum within the market. The momentum is growing, but not in the way that would merit a move to $15,000 before the end of the month.
We would hope that Bitcoin could continue its bullish momentum throughout the following trading sessions this week. If the bullish momentum can continue during the month then we would consider a break of the upper boundary of the long-term symmetrical triangle a significant victory for the bulls within the market by the end of the month.
– Yasin Sheikh

BTC Capital Taxes will be reduced to 19% in France
 Bitcoin capital gains tax in France is 45%, and anyone who is currently into crypto trading will pay a capital gains tax for their profits. A new proposal to reduce the capital gains tax on Bitcoin from 45% to 19% has been introduced. There has been a true ongoing battle to change this law, but this positive development, France could be a real example to other countries.

Bitcoin is not investing, according to Warren Buffett
Warren Buffet, the famous entrepreneur, spoke his mind about Bitcoin investing for Yahoo news on Saturday. He does not consider cryptocurrency to be an investment, and he further explained: "There’s two kinds of items that people buy and think they’re investing,” he says. “One really is investing and the other isn’t." Bitcoin, he says, isn’t.
“If you buy something like a farm, an apartment house, or an interest in a business… You can do that on a private basis… And it’s a perfectly satisfactory investment. You look at the investment itself to deliver the return to you. Now, if you buy something like bitcoin or some cryptocurrency, you don’t really have anything that has produced anything. You’re just hoping the next guy pays more. You aren’t investing when you do that. You’re speculating. There’s nothing wrong with it. If you wanna gamble somebody else will come along and pay more money tomorrow, that’s one kind of game. That is not investing.”

80% of the maximum BTC supplied was mined
 From the 21 million Bitcoins in existence, 17 million were mined. With just 4 million Bitcoins left to be mined, the value of Bitcoin should increase as the demand grows, with the offer being limited each year. In this moment, 1800 bitcoins are generated each day, thus Bitcoin having an annual inflation of about 4%. The next bitcoin halving will take place on May 2020. When that will happen, there will be less bitcoins sold by miners, and the market will see less sellers and more buyers, thus increasing its price. If the adoption of cryptocurrencies keep the increasing trend and there are no factors affecting the network, bitcoin price should moon once again.

Bitcoin’s price decreased below $7 900 after Schneiderman’s address to 13 crypto exchanges
As an aftermath after New York's General Attonery announced that it wrote an open letter addressed to 13 cryptocurrencies exchanges, asking them to be more transparent, Bitcoin's price decreased below $7 900.


Bitcoin’s price could reach $25 000 in 2018 and $250 000 by 2022
 Bitcoin's price has stabilized at around $8 000 this week. According to Wall Street analyst and Fundstrat founder Tom Lee stated: “We still feel pretty confident that bitcoin is a great risk-reward and we think it could reach $25,000 by the end of the year,” said Lee.
Billionaire Tim Draper predicts on the long therm: “I’m thinking $250,000 a bitcoin by 2022 [...] Believe it. They’re going to think you’re crazy, but believe it. It’s happening and it’s going to be awesome!”
Draper also predicts that blockchain will disrupt and transform finance, healthcare, and many other industries. “It’s honest, it’s straightforward, it’s incorruptible, and it’s fair,” he said.
U.S. Marshals is holding an auction to sell 2,170 bitcoins
An official address from the U.S. Marshals states that they will hold an auction to sell about 2.170 bitcoins.
The U.S. Marshals are auctioning approximately 2,170 bitcoins in connection with various federal criminal, civil and administrative cases during a six-hour period March 19 from 8 a.m. until 2 p.m. EDT.
To register, potential bidders must complete all registration requirements by noon EDT March 14. A $200,000 deposit is required to participate. Deposits will be returned to non-winning bidders.
Bids will be accepted by email from preregistered bidders only. The bitcoins are offered for sale in 14 blocks: two blocks of 500 bitcoins, 11 blocks of 100 bitcoins and one block of approximately 70 itcoins.
The winning bidder will be notified March 19. Further details on the auction are available at www.usmarshals.gov/assets/2018/marchbitcoinauction.
Additional information about the U.S. Marshals Service can be found at http://www.usmarshals.gov.
An economist from Harward thinks that Bitcoin’s value could be worth $100 in a decade
Bitcoin's price could fall down to $100 in a decade, according to Harvard University professor and economist , Kenneth Rogoff, told CNBC.
"I think bitcoin will be worth a tiny fraction of what it is now if we're headed out 10 years from now ... I would see $100 as being a lot more likely than $100,000 ten years from now," Rogoff told CNBC's "Squawk Box."